🎙 THE STRATEGY GAP PODCAST
Unlocking Data’s Role In Strategy Execution
DECEMBER 20, 2023
About this episode
From Dashboards to Decisions
In the quest for data-driven success, the importance of incorporating data into planning and execution is well-known.
In this episode, Joe and Jonathan are joined by Will Ritchings, Director of Revenue Strategy and Operations at SecurityScorecard, who delves into the challenges of data management, provides insights on effective dashboard design, and reveals key elements for a successful data strategy.
Tune in as they explore:
- The critical role of context in data analysis, preventing misunderstandings and promoting informed decision-making
- Strategies for creating impactful dashboards, emphasizing the importance of balance and tailored approaches for diverse audience needs
- Insights into crafting a successful data strategy, covering goal prioritization and effective communication of time and effort commitments
Guest Intros

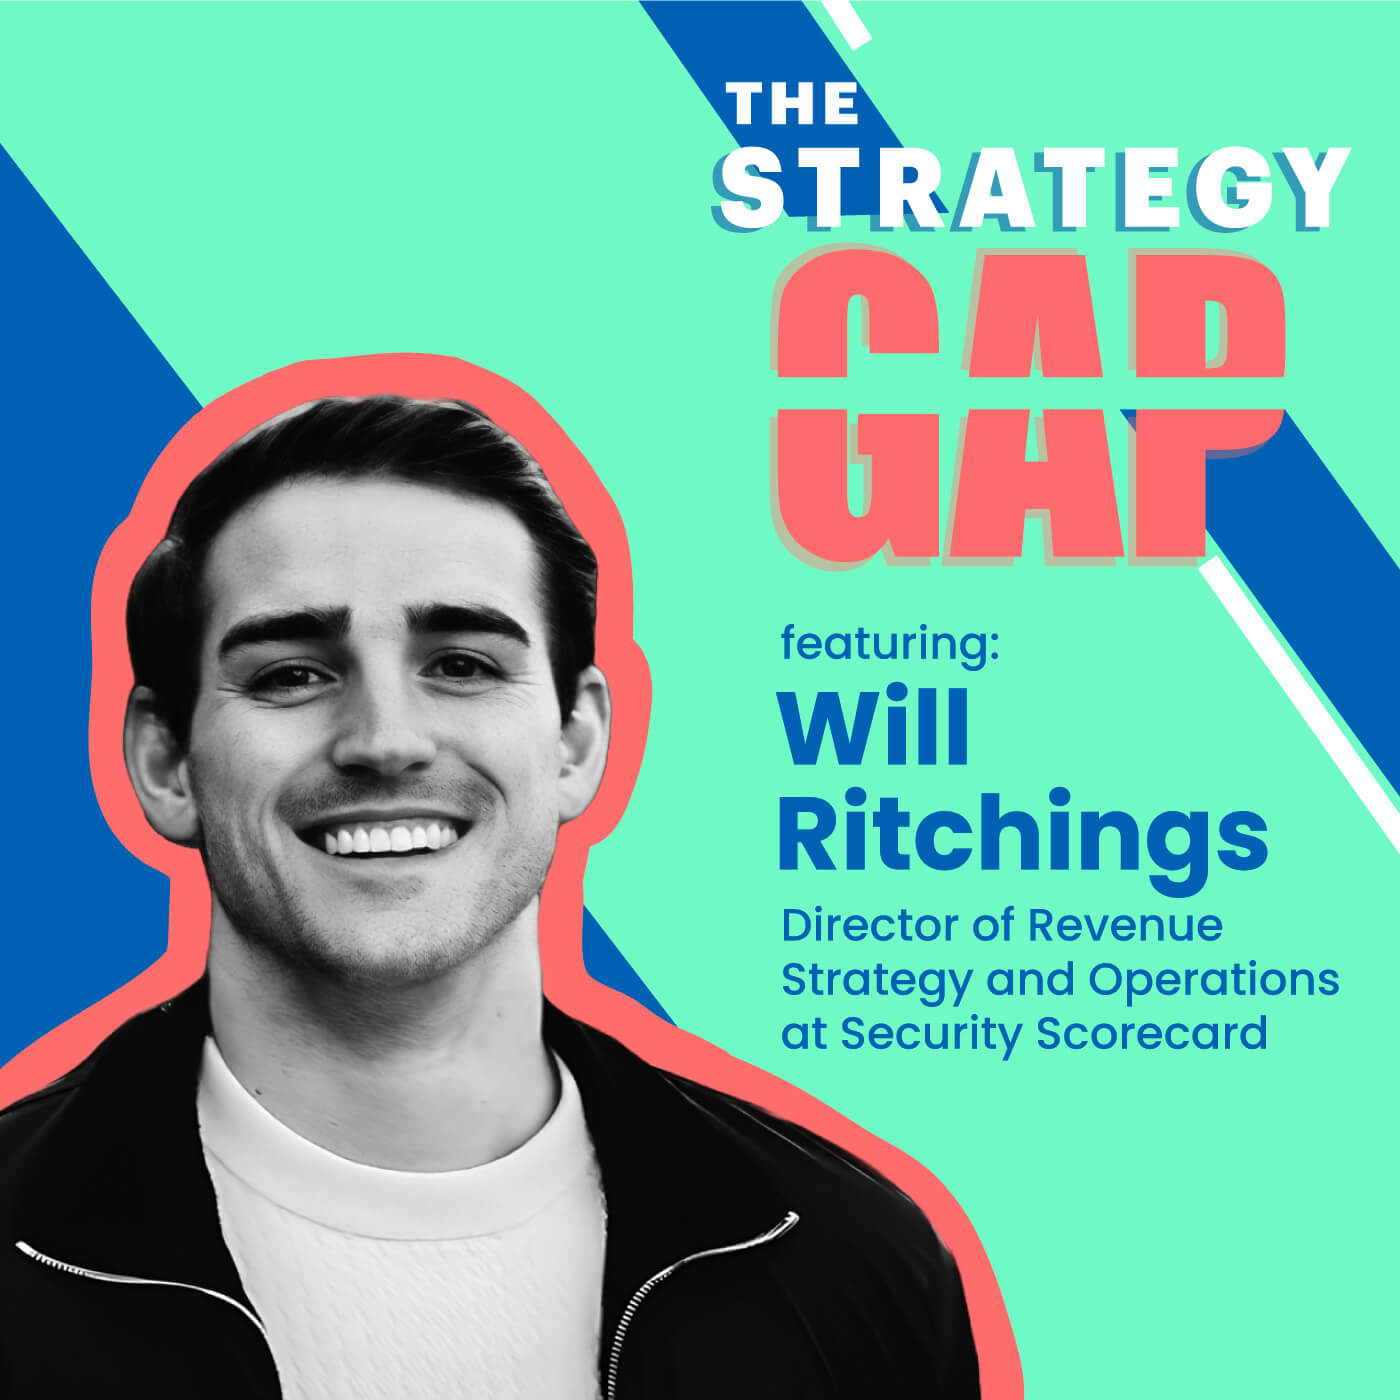
Will Ritchings
Director of Revenue Strategy and Operations at SecurityScorecard
Stay connected
Sign up for our email newsletter to stay up to date with the latest news and episodes.
Jonathan Morgan [00:00:07]:
Welcome back, everybody to another episode of the strategy gap. today. Joining us for another fun conversation is Will Ritchings, all the way from New York City will is the Director of Revenue Strategy and Operations at Security Scorecard. He has an extensive experience in revenue strategy, BI and analytics, along with helping high growth companies leverage their data to define and track go to market initiatives, our conversation today we'll be discussing the importance of data how to leverage successfully within strategy, execution, and much, much more. So, welcome to the show, Will.
Will Ritchings [00:00:39]:
Thanks, Jonathan. Thanks, Joe. Happy to be here.
Jonathan Morgan [00:00:43]:
Perfect. Well, diving right in. Certainly, there's a lot of aspects within strategy that involve data, and often is a very key role. But for at least from my experience, what I find is companies typically don't have a great handle on all of their data. It's either too much data, too little data, but rarely is it the right balance. So, to kick things off, I wanted to get your perspective on how do you think about data? And its role within strategy and strategy execution?
Will Ritchings [00:01:10]:
Jonathan, that's a really great question. You know, I think, you know, today everybody is so data driven in business, you know, you get you an interviews, you could be talking to a CTO, or CRO or anybody, they'll mention that they're data driven. And I think that it has real because it has relevance everywhere, it's especially important to really define its role at certain ventures or certain junctures of a company. You know, and as a company is planning out, or going through that process of looking at what their annual plan is, or what goals they want to accomplish, David can help demystify some of the variables or assumptions. Or, you know, while you're halfway through those goals, and tracking progress, well, you're gonna rely on your KPIs and metrics there as well. So um, you know, it really is just ever present or evergreen, but what data points you track is really paramount to success.
Joe Krause [00:02:05]:
So, with that being said, I mean, I've worked with a lot of clients that build their strategic plan, and we have a software that helps them execute that plan. And sometimes the things they're tracking are quantitative, and they're like, we'd love to pull the data from our other systems and air quotes into the plan. And then we always say, most definitely, can you please walk us through that where that data resides, and that's where the heads explode. Because sometimes they might have a data lake, they might have all the data that ever existed, but the idea of finding that exact point that they need, that can feed into a system that they can rely upon, is very elusive. So how have you managed that process of helping organizations get a handle and like kind of put their data in a headlock a bit, to get a better sense of where things actually reside? So, they can use it to their advantage?
Will Ritchings [00:02:49]:
Yeah, you, Joe, you're making me chuckle a little bit. When I'm working with my customers, my internal stakeholders, I tend to ask them to describe things in Salesforce speak, you know, you know, the best that they can tell me the filters the criteria, what are they really getting at? And a lot of times, that's a challenge, but that's sort of the goal of an analytical team, or a data focus team is to translate that ask for that request into, you know, sort of the data language that you're going to get the results out of. You know, it is it is, it can be fun, it can be complicated. And I think a lot of times the tendency is, you can it's really easy as a request or stakeholder to start to just throw out or blurt out that shopping list, I want this I will Oh, I want that. And, and that's really the software, the soft skills come in, you have to run the discovery process, you have to say, Well, tell me a little bit more about that. Why is that important to you? Is it a nice to have? Is it a need to have? If we didn't have it, you know, we'd be lost at sea? Or? Or would we have another way to get to shore?
Joe Krause [00:03:54]:
Because I mean, we're talking about essentially, is that sometimes you can arrive at that sometimes the data is so elusive that the data is coming from a system. And then it's moving into multiple human’s hands analyst at the end of the month, they said, Well, I get a report from Jim, that shows me all this. How hard could it be? And it's like, no, no, that's not coming from a system. Originally, it did. But it's filtering its way through human hands. And that's the number that you end up seeing. And that has been a challenge, at least for me to navigate through that because they think they have a handle on the data. But when they peek under the covers a little bit, they have they realize, Wow, this there's a lot of moving parts that make this process not as reliable as I would hope were that person sick that one week then also, we don't have the data versus it actually living in a system. So, have you had any experience with getting people to the point where they are able to automate data a little bit better so they can actually rely upon it and it's in the right place at the right time?
Will Ritchings [00:04:47]:
Yeah, absolutely. The one of the biggest challenges companies face oftentimes, especially sort of high growth companies going through this maturation cycles, is getting that single source of truth locked down who is, you know, who is the key holders for that data that report where and then, you know, supporting it with governance and policies and data freshness to ensure that, yes, that that person has the answer that they are the individual over maintaining that given data source or data lake. But even if they're out, it's supported by freshman's policies. So, if a, you know, internet goes down, a job doesn't complete, the data gets out of sync, there's alerting otherwise, you know, you're left doing analysis or drawing conclusions from extremely stale data that can drive a strategy wrong. You know, it's a lot to do with governance and staffing. And at the end of the day, pushing back on stakeholders to when they go, Hey, I got this report, I got this number. And they go, Oh, well, where did you get it from? Oh, I got it from I got it from Tim and accounting, it's like, well, that's great that Tim helped you out. But you know, 10, that you should really be looking at the data, the insights team on in Reb ops, or, or in your engineering team, they're going to be the single source of truth, they have the definitive answer for what you need.
Jonathan Morgan [00:06:02]:
Yeah. And in certainly, there's the challenge of getting the data and how do we actually have that sustainable, but as you know, it's garbage in garbage out, you have to make sure that stuff that's actually coming in and being updated, whether it's was updated on time, or whether it's recent, or it's fresh, if not, you're looking at a data set that you may assume is correct, is actually six months old, because it hasn't been being updated. So, when you talk about your data policies and data governance and data freshness, what does that mean? We're tact, more and more tech, actually, and within organizations actually frame that up.
Will Ritchings [00:06:37]:
It can mean a lot of things. But ultimately, it's about quality of the data, the accessibility of it, and the frequency of it, who, you know, who needs it? So where does it reside? And where does it have to get to? You know, what are they doing with it? What's the use case of it? Is your data, is it structured? Is it unstructured? And when it arrives to that its destination? Is it arriving in the format, that's, that's usable? And that's going to maximize the value that your end users are stealing from it? And then of course, it's how often do they need the data? You know, there's, there's depending on size, and depending on the frequency, you can run into constraints and scalability issues. And if it's not fully automated, you can, your team could end up spending a lot of time maintenance, you know, pushing that button, so to speak, of just running that report executing that task over and over again, and you have to think about the opportunity cost that that represents and the risks there are. But if that's something that you know, for an analyst or data scientist, it's you, you have to get comfortable running that process, owning the discovery, and really honing in on the specifics that an end user or an executive might want.
Joe Krause [00:07:52]:
We're talking about data quite a bit, which I think is something that it allows you to make, as you would suspect data driven decisions in a strategic planning process, which is ultimately the most important because as you're going through the year, you're getting new data in and based on that you're hopefully course correcting versus just seeing how it goes which a lot of clients that we work with can attest to in the past, that's, you know, this, this information is not great, but we'll just give it a few more months, and then they're too far behind the eight ball to make a change. But when we say data, we think of numbers, percentages, and dollars. But in your experience, where does the role of context come into play, the more qualitative things were, the way that I used to actually was with a client yesterday, if I go to an art museum, and I see a beautiful piece of art, I can appreciate the art for being that. But I do enjoy the placard underneath it, I do enjoy what knowing where it when it was painted, and what the person was thinking. And it gives me more context, either appreciate it more or less. So, when you're thinking about data, just having the number on some sort of marquee, there is something missing if there isn't a human explaining it. So how do you then leave that in there so that the full context is there?
Will Ritchings [00:08:55]:
Yep. And I run into this issue a lot. And I see it a lot with my coworkers. And then especially when you're creating dashboards or resources for executives, leadership, that are sitting all the way at the top and are really far away from that analyst. You know, and the way to bridge that gap is context. Right? No data point should sit by itself. Because it's important to know, like, you know, if I sent you an email, and I noticed 168% increase in a metric, but I didn't tell you what time period had happened over I didn't tell you from where it started to where it went, you know, and ended up telling you that we hired a BDR and they booked one meeting and then they booked 17 The next week, well, that's amazing for that person. But if it's, you know, that's if it's a week over week result rather than an annual result or quarterly. Those are very different implications. So oftentimes the context you know, you want it you want to associate if it's, if it's a number of to flat number, you want to associate it to a percentage rate, and you want to indicate the time period and exactly what it is that you're quantifying. Is it your company's total? ARR? Is it? Is it a growth lever or an incubator? Is it? You know, Where's that coming from? What's the source. And then also, I think it's also important to be transparent in your reporting. And include any bias or any cause for doubt not to disrupt the reporting or the info you're giving. But to let your end user, your stakeholder know that, hey, we feel pretty great about this. But you know, garbage in garbage out, as you said before, and we have to let you know, you know, take it with a grain of salt, but it is enough to move forward with.
Jonathan Morgan [00:10:37]:
Yeah, absolutely. And I think data is important, but you can easily take data and craft whatever story you want to. And I think an important aspect of removing that from the equation is presenting it in a consistent way that's also providing unbiased perspectives on the data. In most cases, that's effective dashboards, where you're balancing the different perspectives are balancing quantitative and qualitative. But that's definitely something that I see a lot of organizations struggle with is creating effective dashboards. It's either a million data points, or it's two data points. And it's tough to balance everything in between. So, in your experience, how do you create effective dashboards that drive alignment while also having the right information?
Will Ritchings [00:11:22]:
Yeah, John, it's a funny one, because I tend to look at the dashboard, and especially when companies are moving faster, are constantly innovating heavy R&D and, and there have multiple balls in the air at once, where they're where they're going to market. The tendency is to get that Periodic Table of Elements style chart with every single thing imaginable. And that's, that's great. And, you know, we're gonna maximize the knowledge. But when you actually go to operationalize that, or use that to support a strategic discussion, you'll find that, you know, people have competing priorities and conflicting interests, and they tend to want to focus on the things they know the most about, and the biggest red flags. So that's where a data leader, a technical someone technical that can help bridge that gap, or your chief of staff can come in and help guide the conversation. And a lot of times that periodic table needs to be shrunken down or split up to allow a group to have effective discussions around a singular topic. You know, you you've all probably, you know, both of you have probably heard the paralysis by analysis, or kid in the candy shop. And I think that, especially in times of uncertainty, or growth, or brand new strategy, you want as much data as you can, as you can capture, you want to be as certain about something as you can. But a lot of times, you're not going to have all the answers and you need to rely on I kind of look at orders of metrics, what's the first order versus a second or third order? Because very likely, to influence the first order, there's going to be smaller data points that ladder into it. But is it worth looking at? Right? You know, how really in practicality in reality, how much is x going to impact why. And if it is impactful, great, let's talk about it. If not, get it off the dashboard, remove it, remove it, remove it, reduce, reduce, reduce.
Jonathan Morgan [00:13:18]:
Got it. Yeah, definitely want to dig into the different layers of data in a second. But I want to clarify one thing you mentioned earlier, when you talked about bringing in a data expert or chief of staff actually go over it. Typically, what I see is you know, if it's sales numbers, a salesperson is talking about a marketing numbers, a marketing person is talking about a product things a product versus talking about, are you saying bring somebody else in to lead that discussion. So, you are removing that bias or is that handled in a different sort of way?
Will Ritchings [00:13:43]:
No, I am usually the, an unbiased, you know, unfavored ID, party or delegate is, you know, somebody who's oftentimes technical like a, a manager, or someone within the DevOps or who's working day in and day out with the metrics, the data points that they're working with the stakeholders for the departments, but they're not incentivized by the performance of a given metric. You know, you see it all the time. There's major risks. When you leave all the reporting up to the person who's ultimately their bonus, or MBO plan is tied to those numbers, you kind of get into that gory or vanity metric risk. And that's where it's crucial for organizations to maintain a stream of accurate and unbiased results and information with someone guiding it who doesn't have the incentive to go for or against.
Joe Krause [00:14:37]:
And so, you meant you mentioned earlier to when you're creating a new dashboard, the idea of sometimes if you're looking at it too much the incentive might or that the incentive, but the way that people might think is they see any little change, they start to freak out. And so like, it makes me think of all the movies where there's a battle scene and the generals like hold and like, there has to be enough time in order to really understand if something is a trend or if it's a momentary blip, it's the difference between like a day trader, at somebody who's looking at every millisecond, every little, small trade versus the value based investor. So, I guess that speaks to the idea of making sure that your dashboard has a good healthy combination of leading and lagging metrics, because a lot of times, lagging metrics could take a longer time period than we'd like to improve, but at least we have a canary in the coal mine I'm leading. So, is that a 5050? Split? In your experience? Is something a little bit more like 6040? How have you seen that really work to ensure that there's enough there so that people don't under react or overreact? Something right in the middle? Right?
Will Ritchings [00:15:37]:
Yeah, I tend to think of that as decimal point, demise. In a sense, you know, it's, oh, my goodness, you know, our conversion rate went from 32.8 to 32.6. Well, sound the alarms we need, we need to you know, stop the press, we have to have, you know, you and you go right, in his own style narrative into exactly what happened, what's the causation behind that point? 2% decrease? Well, you can go and do that, but very likely, your time is gonna be better spent, you know, other in other areas of the priority. So, you know, the risk there is, oftentimes you're gonna get into situations where you're gonna see… Oh, my God, sorry, guys. My audio is a little shaky here. My sound okay. Joe, so can you… what was that?
Joe Krause [00:16:36]:
Say again?
Will Ritchings [00:16:37]:
Guys?
Jonathan Morgan [00:16:38]:
Yeah, I can hear you.
Will Ritchings [00:16:39]:
Okay. Okay. Sorry. Sorry, by that I think we are okay.
Jonathan Morgan [00:16:45]:
Pick up wherever you feel most comfortable picking up? If you want to start rephrasing the whole answer. Again, that's fine. Wherever you want to…
Will Ritchings [00:16:51]:
Click pause, I completely, like completely blanked on my bad. Joke. Can you start that conversation again?
Joe Krause [00:17:00]:
Yeah, absolutely. So um, when it comes down to is with dashboards, sometimes if you have a lot of data in there, and you have some leadership that's really excited about seeing it, and they really are paying attention to it, they might get the wrong impression about data that's on there, they'll see a small change and then redirect all resources to impact that. So, we always talk about when we're helping our clients build strategic plans, that the metrics, they have to be a healthy dose of leading and lagging metrics, knowing that lagging metrics will take a while to be impacted. But the question I have for you is really around. What is that sweet spot? Is it a 5050? Split or dashboard? Where there's leading and lagging? Is it 8020 6040? What have you seen be effective?
Will Ritchings [00:17:38]:
Yeah, no, it's a good point. Joe, I think the split, you have to have a healthy dosage of both. But it's how you use it throughout a process if it's a quarterly or fiscal the fiscal year. And then And then, you know, at what points and what you're looking at, right. lagging indicators, right, as we know, you have to collect we talked earlier about you have to collect a sizable sample size before you can draw conclusions. And is it you know, if you're looking at things like your average sales price for ASP, but you've made for sales? Or you know, you're two weeks into your quarter? Well, it's not going to tell you a whole lot. So, what my team employs, and what I've seen work in the past is earlier on in a cycle, looking at and leaning on the lagging, or the leading indicators, rather more so and putting greater emphasis on them? What positive signals or risk factors are we noticing? And what are the downstream implications that they may have? And do we have time to impact those to dig in, or to draw insights out of it so that if we have missed our shot, this time around, we're more prepared the next time. And for lagging indicators, even if it's early in the quarter, we tend to try to look at forecasting methods around them. Rather than looking at what is the hard and fast that close to one opportunity, kind of, you know, close the book result, what could it be, and kind of turning a lagging indicator into a leading one? And then tracking it over time having those check in points and saying, Are we still on track? Are we headed behind our goals? Where are we compared to our linearity and then making gametime decisions around that?
Jonathan Morgan [00:19:20]:
And I think outside of just what is the balance of lagging and leading indicators, I think an important thing to consider is who is the audience that's going to be looking at this is well I think anybody that's a sports fan or even if you're not hopefully you can attest to this, you know, if you if you're out on the road and your team is playing a game, you're gonna pull up ESPN app or something else. And the first thing you're going to see is, is you're going to see the score. And then if you want to look more you can dig into the details quarter by quarter player by player and you'll look at previous games, but you wouldn't ever expect to pull their phone and all of a sudden, you're seeing one of your players stats and have no idea of the score. So, you have to have that balanced approach based on who you're trying are getting to kind of coming out of that you keep the analogy going or ditch it. But how do you think about building dashboards for the audience that you're actually presenting to, and who's actually consuming that information?
Will Ritchings [00:20:12]:
The design is paramount, it needs to tie directly to your audience, you know, because they're going to have different levels of interest. And they're also going to have different amounts of time to render a decision, right? I, you know, there's this this model or this concept of the decision making pyramid between an analyst and a C suite executive. And, you know, at the bottom of it, the basis, the context at the top is decision making ability. Well, the analyst, they've got that heavy base with that, that upright pyramid shape. So, they have all of the context and not oftentimes a lot of the decision making power. When they're speaking with an executive. It's flipped, it's on its on its point. And they have the executive has noted the context and all of the decision making power. So where do you find the balance in between? And it's, you know, your, your bluff models, the bottom line up front, tell it to me straight, I'll ask, you know, and then really being transparent, saying, I can tell you how the sausage is made, but how much do you want to know? You know, I have the context. But how much do you need to know to trust that I know what I'm talking about that the results are solid, and you have what you need to go and move on and then impact the business. So when you design the dashboard, a lot of times it is that bottom line up front, top line, you know, the score of the game, right the NFL standings and then if you want to play by player, the players there's that it's if it's a Google sheet, you can use a JSON or associated tabs, if it's, you know, a BI platform like Tableau, you know, clicking the links or embedding things in clever ways to enable that drill down functionality. But the design component is so crucial because it directly impacts your users experience, and how efficiently they can gather that data.
Joe Krause [00:22:00]:
And not to fall into the trap that Jonathan mentioned earlier around. Data can tell you whatever story you want, you know, Mark Twain lies, damn lies and statistics. But what how do you feel about the concept of having different dashboards for different folks within the organization where it's sort of the analogy I give for people is, the reason why the New York Post is been successful these years is that the front page is the is the news. And if you flip it on, its back, it's the sports, right? So, if you're a sports fan, you're not digging through right there. And so the idea of you're the CFO, and maybe there's three or four metrics that really keep you up at night, is the idea of maybe having an extra dashboard where the front page or those three things and everything else is exactly the same, but shifting it around so that the conversation goes smoother, or does that lead to some bias where maybe you're leading the witness, so to speak, what have you seen with that type of approach,
Will Ritchings [00:22:47]:
I tend to encourage, when I'm, when I'm looking at a Dashboard Designer, or working with others, we put it all out front, we put it you know, blatant in plain view, as much context as we can provide as much as the whether it's bad news, or good news, the dirty details are important. But you know, you want to lead with the headline, you want to say, we didn't have a good quarter, you know, it is down, you know, and then but also, if you want to learn more, you know, here, go to the next page or click into this, this row, expand this column. And, and we'll give you the last reasons, we'll give you the winter reasons, we'll give you some of the trends and insights. And it's also about engaging the right people. Do you have the people in the room in the discussion who can effectuate change, where the insights and then and then make that difference? You know, if it's Hey, okay, are sales are down, but we learned XY and Z about our customer base. And we you know, now we know that we need folks from POC to come in and receive that feedback, so they can action on it. So, it you know, it's not always the stakeholder being an executive, but it's somebody who may be somewhere in the middle and can lead that change forward.
Jonathan Morgan [00:24:00]:
Yeah, makes perfect sense. And I think for a lot of organizations, they can if they attest to this, but for those that aren't nearly as advanced yet on, you know, how do I tweak my dashboard, it's, well, a dashboard is great, but I don't have the data to actually build the story that needs to be built. And certainly, in your career, you've had some experience building data strategy from the ground up. So, you know, on the other end of the spectrum, and for organizations that aren't quite there yet, with their data strategy and their data architecture, how do you get started on that? What's some of the first steps that you can do to build a successful data strategy? I
Will Ritchings [00:24:35]:
think it's important to start with the end goal in mind. Right? What are we trying to accomplish? And what is in that scope and what's out of it? Because otherwise, you start to get the spinning wheel of death, you try to chase down every data point you can gather, even if it's not a lot, but you might end up creating a lot of noise and joint collisions or things that you actually didn't need to focus on. I think when it comes to designing a system or integrating a data lake or something that you want to have it to be healthy enough that you've enabled the ability to gather that data, whether it's connecting it to your proprietary internal data, getting it into that CRM or the ERP tool, but ultimately saying, what if, if nothing else, what is the list that I need to have, versus the nice to haves, and we're going to prioritize the need to haves, because they're going to tell us X, Y, and Z, we'll get enough information out of it. And we'll monitor and check that we'll put the data freshness policies in place, we'll set up safety net so that if a job does fail, we'll get an email or your ad, you know, you know who to contact with your admin, or we'll automate it as much as possible, but not so much that you lose focus of it, or it's just completely out of sight out of mind. But you still maintain that sense of governance. You know, its tendency is, oh, my God, we have we have, you know, companies today have so much their tech stack is so rich, that they think everything needs to be connected. But if you know that system wherever there doesn't actually need to speak to this one, don't make that connection. So, it's a lot of deliberate decision making, for building an effective data strategy. But it always, always focuses on the end goal.
Joe Krause [00:26:23]:
How much time do you think it takes to do that effectively? Because, especially for smaller companies? I mean, we're talking like, what's a good what's a good reasonable deadline? is like, have something better than nothing? Is this a multi-year process? Multi week, multi day? What are we talking about? If you really want to do it, at least to the point where it's affecting you in a positive way or a small business? Let's say how long does it take?
Will Ritchings [00:26:41]:
Well, you know, typically, the, the response when you ask that is yesterday, right? Now, it's a massive question. And a lot of times, you don't know what you don't know. And discovery is the is the biggest time suck in that process, you can have the best, most technical, technically focused team on the market, if they don't know where to get something, or they don't know how you know, what we're trying to do, we're going to try to get all the data discovery, we're going to learn as much as we can, before we actually get anything done. So, you know, I've seen depending on the job, it can take months, it can take quarters, larger scale implementations can take a couple of quarters close to a year. But that a lot of times can breed a lot of frustration to you know, you got to keep the execs at bay. Again, with that context, not always understand knowing the value or impact of something, but not understanding the How to and the what needs to get done to get there is dangerous, but you have to have a solid leadership strategy, you have to have communication up and down, up, and downstream. And, and don't sugarcoat anything. You know, I've had great, amazing mentors in the past and of other folks, I've worked with that. You know, when you're trying to make the argument for the additional resources to get things done, well, they said, hey, well, then stop turning everything around next day, you know, emphasize the pain, emphasize the technical skills needed or the time and get staffed appropriately for it. Otherwise, you would set yourself up for failure, and it will take longer than you anticipated if you weren't fully staffed. But it can be a lengthy process. It really it really good.
Jonathan Morgan [00:28:27]:
Yeah, I think a lot of people that aren't close to data also don't recognize that it's not just the time that it takes to create the dashboard and to even do the discovery. But there's a lot of data that you can't get until you have a process built to actually track that. So quick question on your perspective with that, like how do you how do you best communicate that to others that expectation that you know, they want this data now, but they maybe don't realize that you first have to build mechanisms to track this before it just available to throw in a pretty dashboard?
Will Ritchings [00:29:00]:
Yeah, that you run into it a lot of times Hi, Pat, SAS fast-paced companies and you know, marquee long standing dinosaurs, like you want everything, and you want it now, you want that instant gratification, but it can take a heck of a lot to get there. A lot of times that starts with just having that where we are and where we want to go discussion, right? The current state of affairs is this, the ideal state might be that but that, but we are at the base of the hill. And you know, and this is going to be what it takes to get there earlier I mentioned the need to have a nice to have but there's also what can we have and what can't we have even if it isn't that nice need to have list. So, it's that balance and it's I think breaking it up in chunks and making it almost like a sprint or making it like a project, program management kind of kind of cadence where you are providing incremental value consistent, consistently. But everything that you're doing polling, every connection that you make is done with scalability in mind, it's not a one off, it's not it’s not a one-time data dump or an export. But it is a integrated automated solution with governance policies in place. So, once you've checked that box, you don't have to return to it. And you can move on to the next one. And that is kind of the crawl, walk, run, where at the end of that cycle, you've checked all the boxes, you have the governance policies to support it. And you have individuals on the team who are involved, who have clear ownership of different levels of that data management policy. It's incredibly important, because I think one thing that comes up that people don't realize for data teams is just like a PM, or, you know, product owner. Once that product goes to market, there's maintenance involved with it. It's not just there, right? It takes effort to make that keep make sure that dashboard is up to date, that it's ready to go for that discussion. And then you go and build the next shiny toy. That one requires maintenance as well. So, data leaders and analytical leaders need to consider the maintenance impact and the capacity constraint that can place in their teens when they're going through staffing and resourcing discussions.
Joe Krause [00:31:20]:
Excellent. Well, as you can imagine, we could talk about this for days. But we have we are drawing to a close. But we do like to end the podcast with a question that we ask everybody. And it's a pretty fitting as we're going into the holiday season. So, think of ghosts of Christmas Past appears and says, and basically allows you to really say to yourself, What advice would you have given yourself at the beginning of this career and strategy, something that you wish you knew back then? What would that be?
Will Ritchings [00:31:49]:
Sure, I think two things come to mind. One is say no more is, you know, because you're going to cause yourself more stress, more worry, especially when you say yes to something you can't deliver on right. Yeah, oh, we want you know, we want the run rate for this. So, the average product usage metric for that, and you go, yeah, I can do that. And then you go, I don't know how to do that. Oh, I might be in trouble here. Right. So, say no more often. And then also take accountability. Right? If you didn't update something, don't let it go into the meeting. And let people draw conclusions based off of it. Right? Oh, my God, the formulas didn't update down to pass the data and, and we know you've like formula in the pipeline unaccounted for? Well, you know, raise that flag, take accountability, take ownership of it, no one's going to fault you. Even if it's bad news, they're not going to fault you for saying how you tried, you know, what, thank you, like, you know, why did you bring that to our attention, shame on you for it, they're gonna say it if you don't, and it could get you in trouble. So don't assume people know what you know, if you are the person that's closest to the data, promote it, shout loudly. I don't know if you knew this, or, you know, Hey, we gotta be aware of that thing. But you know, those things are gonna set you up for success in an analytical career. And always work on your skills, right 1% Every day, and just keep growing.
Jonathan Morgan [00:33:13]:
Absolutely love that, you know, data is often better than bad data and kind of be accountable for that and make sure the best decisions are made. Oh, well, we appreciate your time on the show today, and look forward to more conversation in the future. So, thanks for joining us.
Will Ritchings [00:33:27]:
Thanks, Joe. Thanks, Jonathan.
Joe Krause [00:33:30]:
Thank you.